A bubble diagram is the simplest form of architectural diagram. It uses circles (bubbles) to represent spaces or functions, and lines to represent connections between them. The size of the bubble indicates the size of the space. The thickness of the line indicates the importance of the connection. There is no geometry yet — no walls, no doors, no dimensions. Only relationships.
The bubble diagram is the first step from program to plan. It answers the question: what spaces need to be near each other, and which need to be separate?
These 12 bubble diagram architecture ideas cover programmatic organisation, circulation, privacy gradients, and site relationships.
1. The Adjacency Bubble Diagram
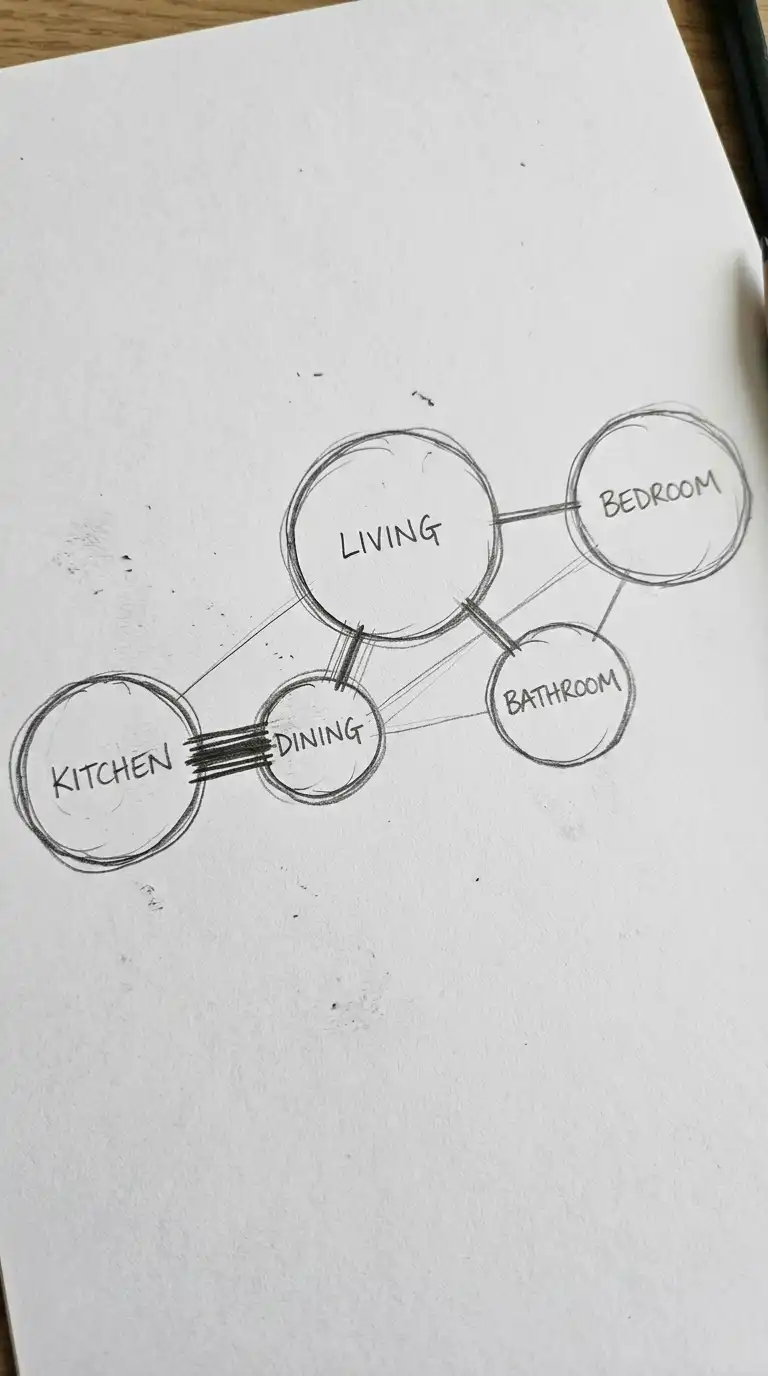
The adjacency bubble diagram is the most basic type. Bubbles represent rooms or functions. Lines connect bubbles that need to be near each other. No line means no adjacency required.
This diagram is the first step in any design process. It translates the client’s program into spatial relationships. A kitchen bubble connects to a dining bubble. A bedroom bubble does not connect to a living room bubble. The emotional effect is logical, clear, and programmatically intelligent.
Quick Tips
- Use bubble size to represent room size proportionally.
- Use line thickness to represent the strength of adjacency required.
- Do not draw any geometry — bubbles should be abstract.
2. The Circulation Bubble Diagram
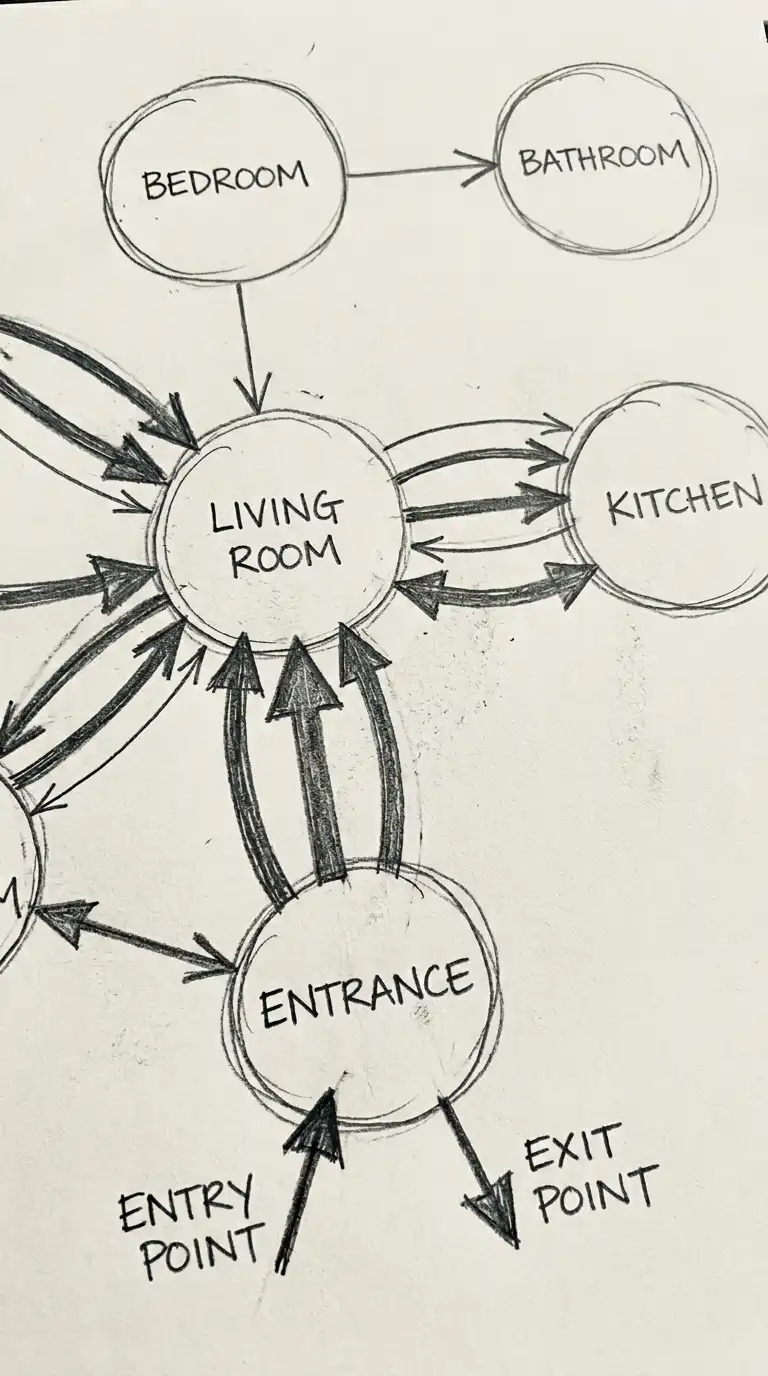
The circulation bubble diagram focuses on movement. Bubbles represent spaces. Arrows show the direction and intensity of movement between spaces. Thick arrows for heavy traffic (entrance to living room). Thin arrows for light traffic (bedroom to bathroom).
This diagram answers: how do people move through this building? Where are the bottlenecks? The emotional effect is dynamic, directional, and flow-oriented.
Quick Tips
- Use arrows, not lines — circulation has direction.
- Arrow thickness should match expected traffic volume.
- Show entry and exit points clearly.
3. The Privacy Gradient Bubble Diagram
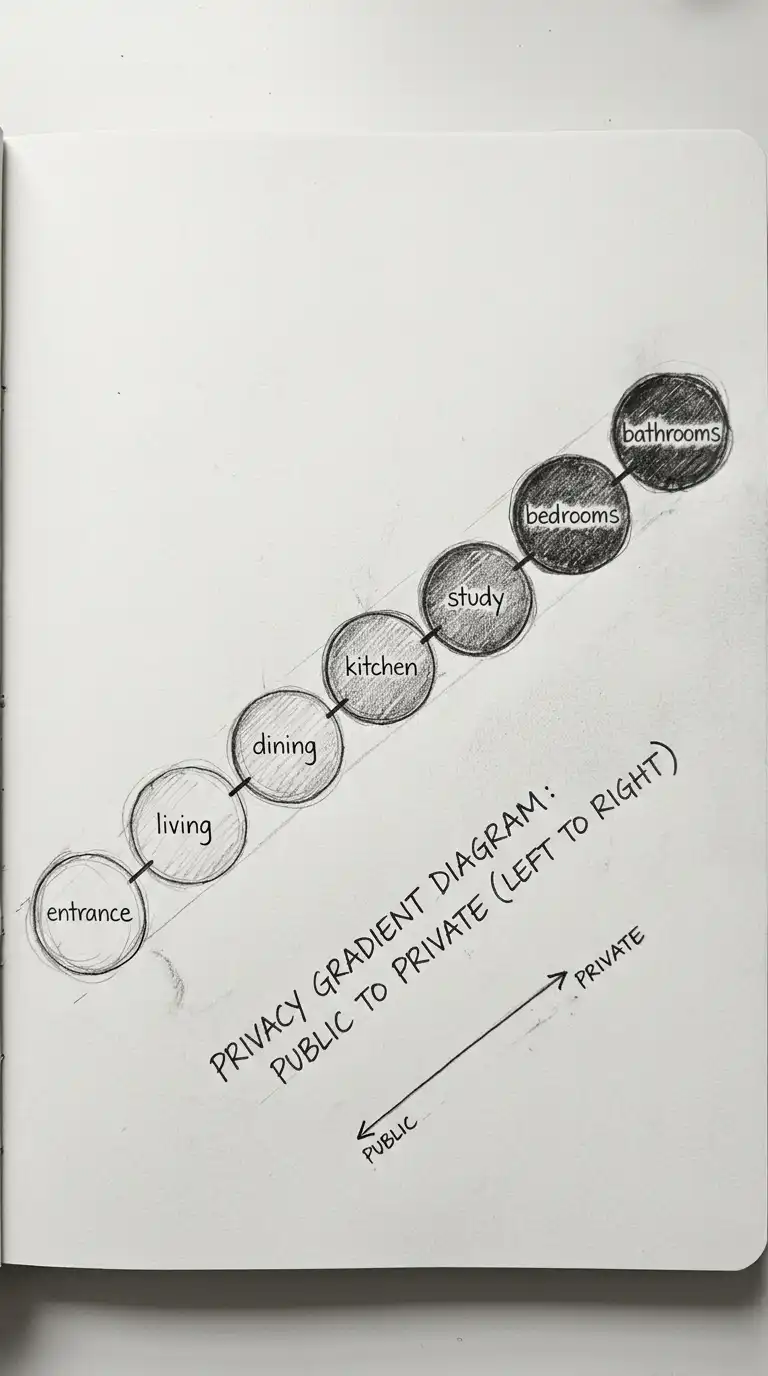
The privacy gradient bubble diagram arranges spaces along a spectrum from public to private. Public bubbles (entrance, living, dining) are at one end. Private bubbles (bedrooms, bathrooms) are at the other. Semi-public bubbles (kitchen, study) are in the middle.
This diagram answers: how does privacy change as you move through the building? The emotional effect is hierarchical, graduated, and spatially intelligent.
Quick Tips
- Arrange bubbles linearly from public to private.
- Use different pencil shading: light shading for public, dark shading for private.
- The most private spaces should have the fewest connections.
4. The Zoning Bubble Diagram
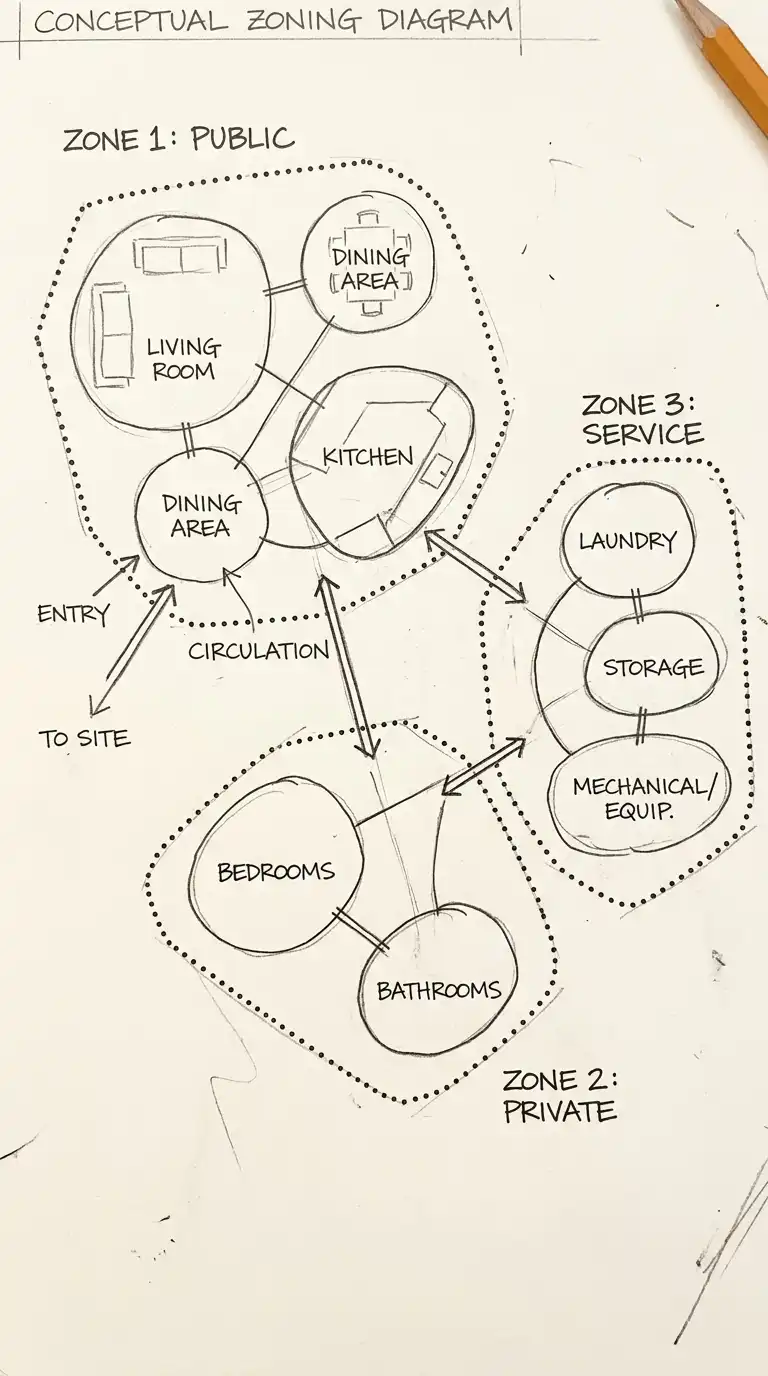
The zoning bubble diagram groups bubbles into zones. A residential zone might contain living, dining, kitchen. A sleeping zone might contain bedrooms, bathrooms. A service zone might contain laundry, mechanical, storage.
This diagram answers: how can the program be grouped into larger clusters? The emotional effect is organisational, efficient, and programmatically coherent.
Quick Tips
- Draw a dotted line around each zone.
- Zones should not overlap.
- Each zone should have a clear relationship to the others.
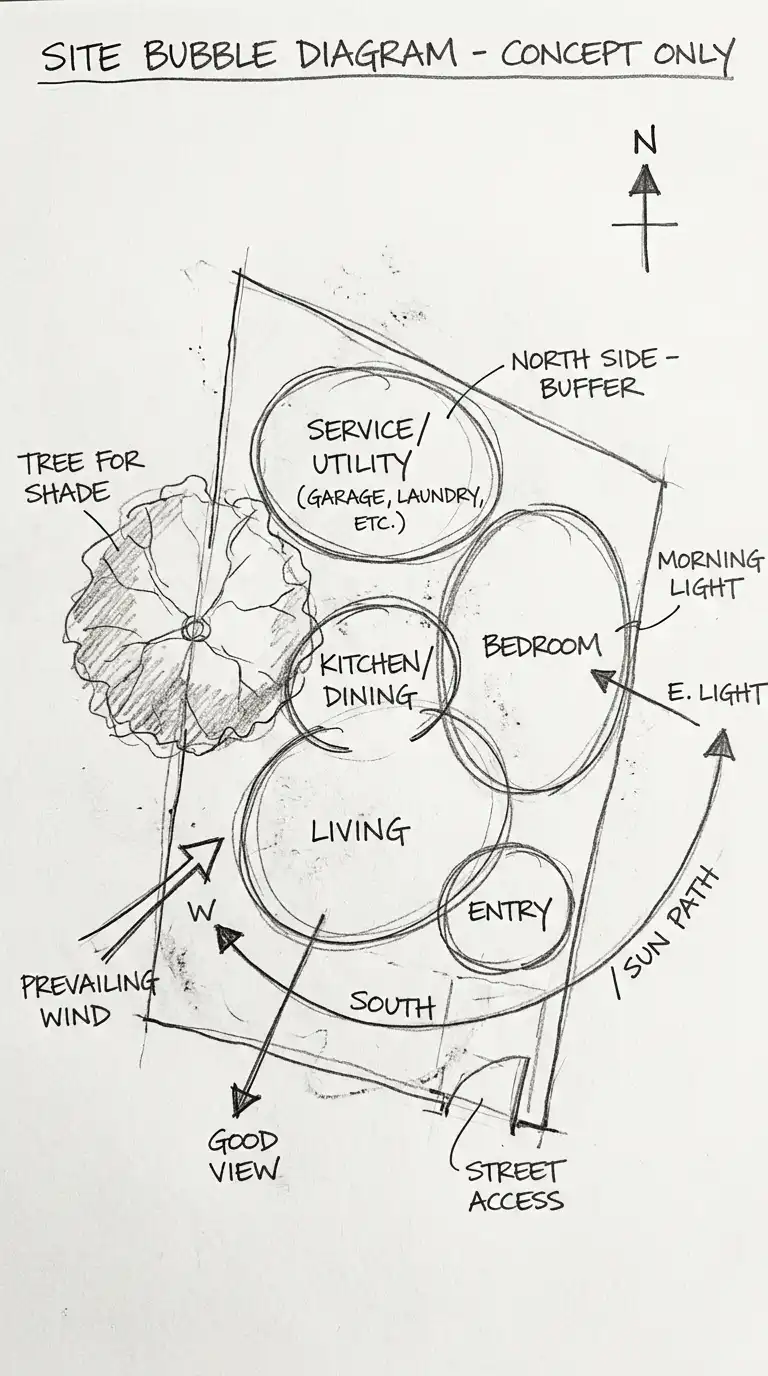
5. The Site Bubble Diagram
The site bubble diagram places bubbles on a site plan. The site is drawn as a simple outline. Bubbles are placed where the functions will go. The diagram shows the relationship between program and site.
This diagram answers: where on the site should each function be placed? The emotional effect is contextual, site-responsive, and spatially grounded.
Quick Tips
- Draw the site boundary and key features (sun, wind, view, noise).
- Place bubbles approximately where the functions will go.
- Keep bubbles abstract — no building geometry yet.
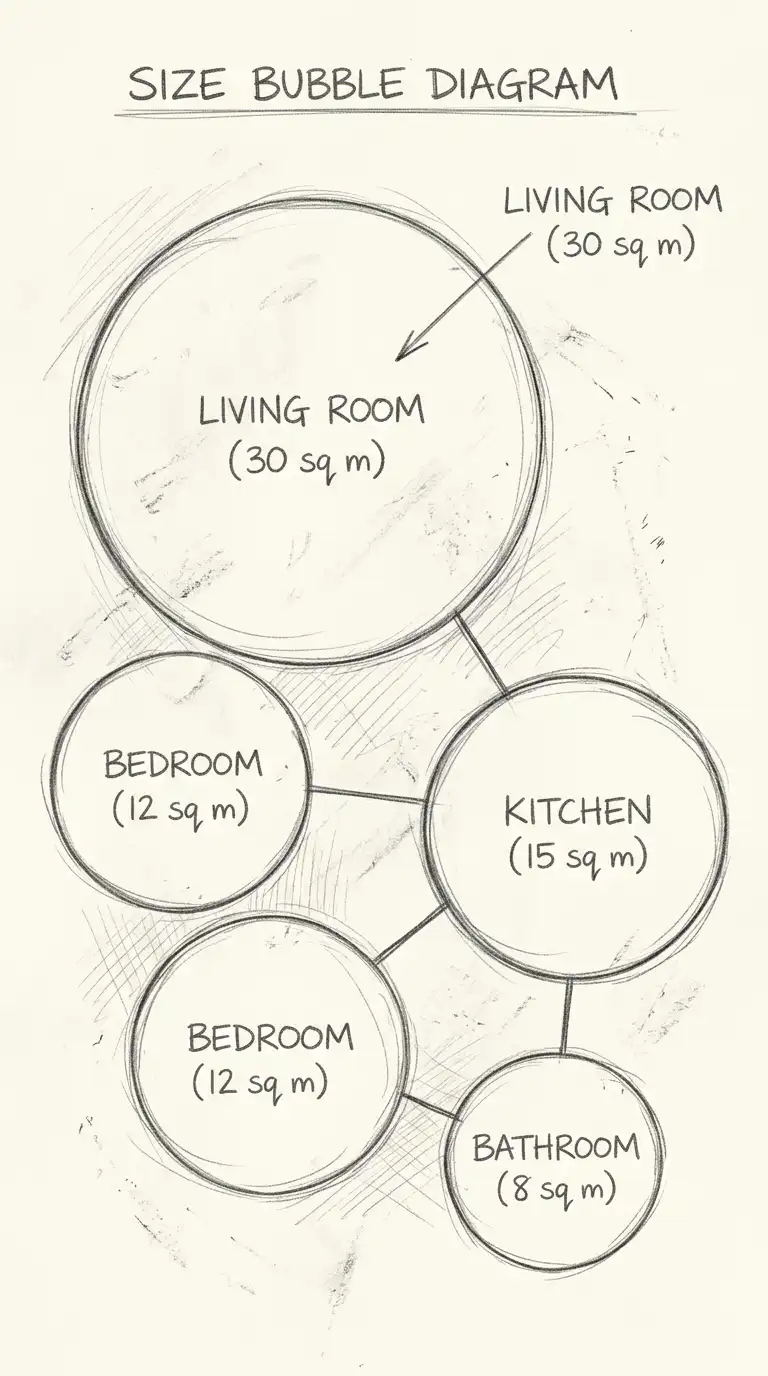
6. The Size Bubble Diagram
The size bubble diagram uses bubble area to represent room area proportionally. A living room bubble (30 square metres) is three times larger than a bathroom bubble (10 square metres). This diagram adds quantitative information to the qualitative adjacency diagram.
This diagram answers: how much space does each function need? The emotional effect is quantitative, proportional, and programmatically precise.
Quick Tips
- Calculate bubble area proportional to room area.
- Label each bubble with its area in square metres.
- Keep bubbles circular — distortion makes comparison difficult.
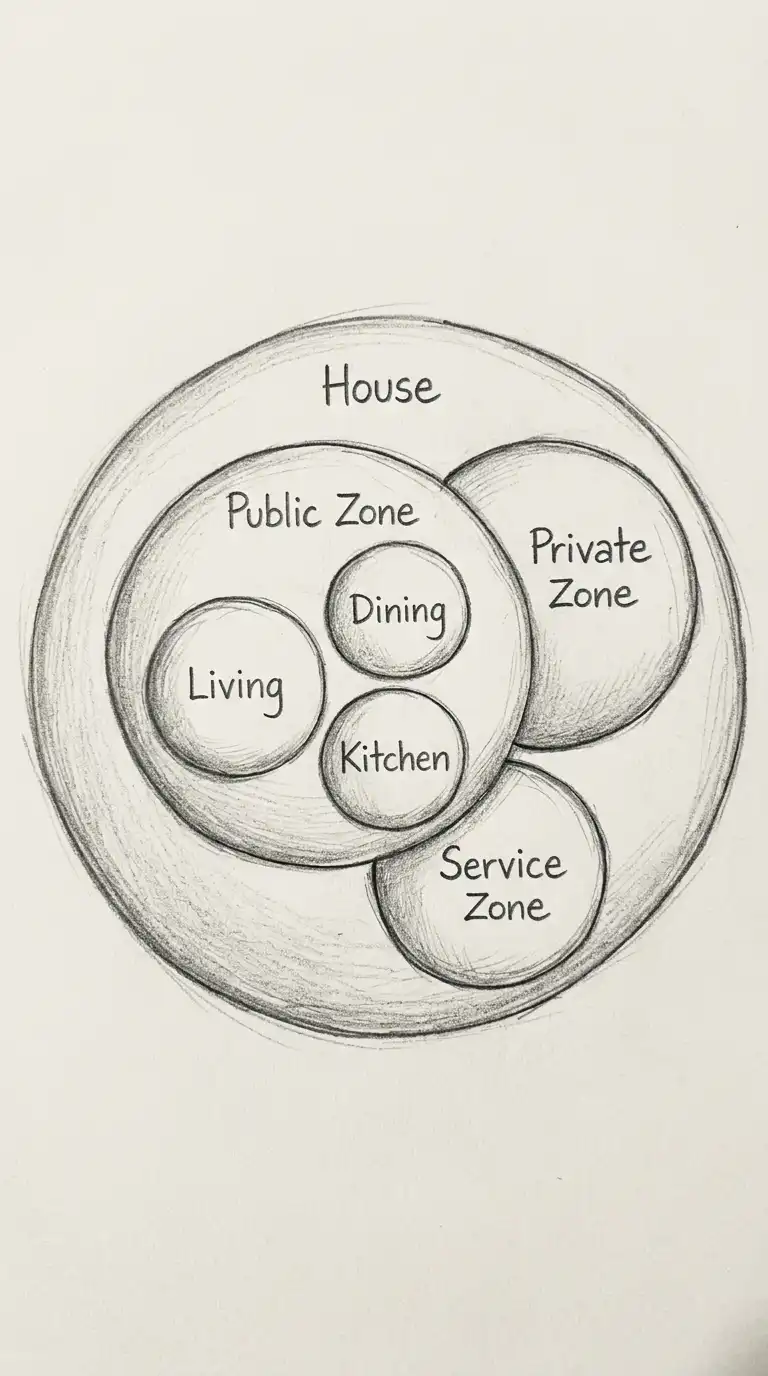
7. The Hierarchical Bubble Diagram
The hierarchical bubble diagram arranges bubbles in a tree structure. The largest bubble (the building) contains smaller bubbles (zones), which contain even smaller bubbles (rooms). The diagram shows nesting and containment.
This diagram answers: what spaces are inside other spaces? The emotional effect is nested, hierarchical, and structurally clear.
Quick Tips
- Draw the largest bubble first, then draw smaller bubbles inside it.
- Use concentric or overlapping bubbles.
- Do not use lines — containment is the connection.
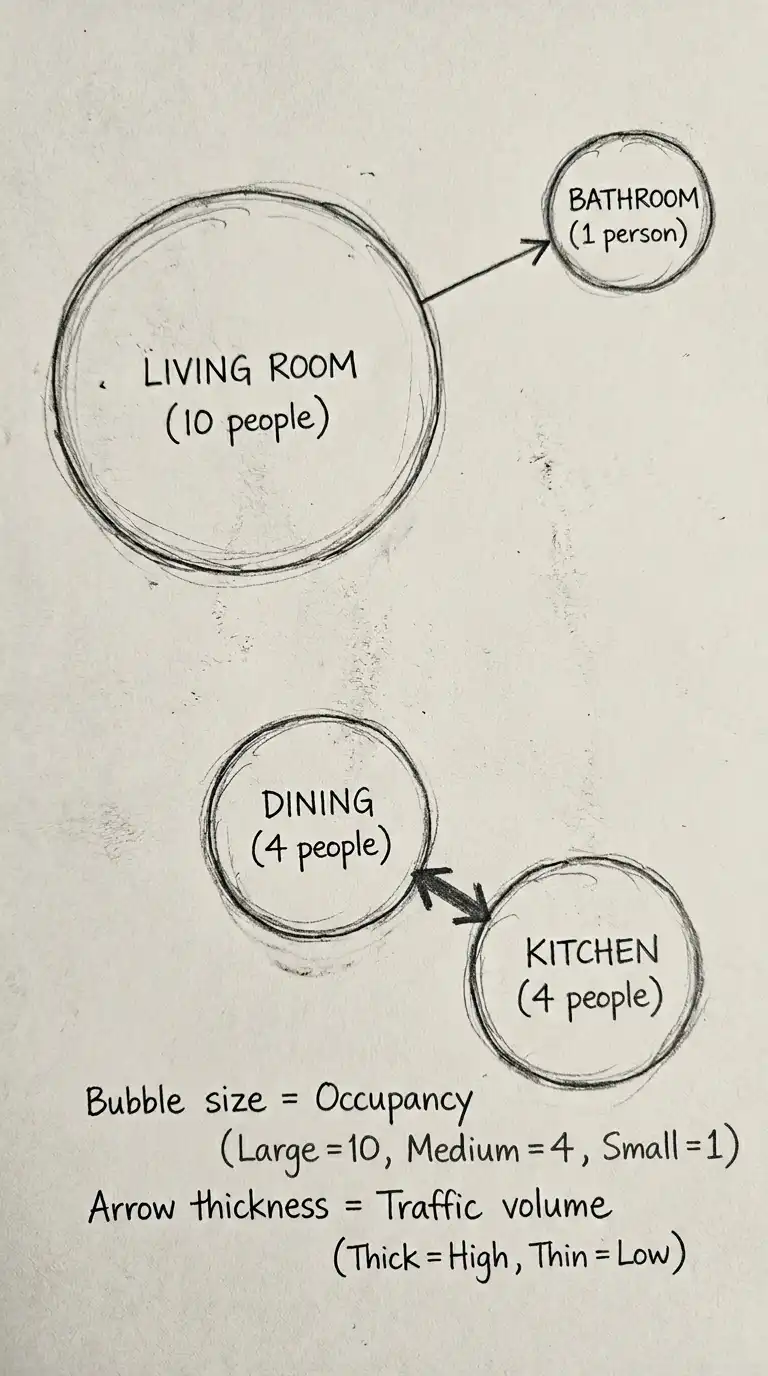
8. The Circulation Density Bubble Diagram
The circulation density bubble diagram adds quantitative information to circulation. Bubbles are sized by the number of people expected in each space. Arrows are thickened by the number of people moving between spaces.
This diagram answers: where are the crowds? Where are the quiet spaces? The emotional effect is quantitative, flow-oriented, and programmatically dense.
Quick Tips
- Bubble size = expected occupancy (number of people).
- Arrow thickness = expected traffic volume (people per hour).
- Use a legend to explain sizes and thicknesses.
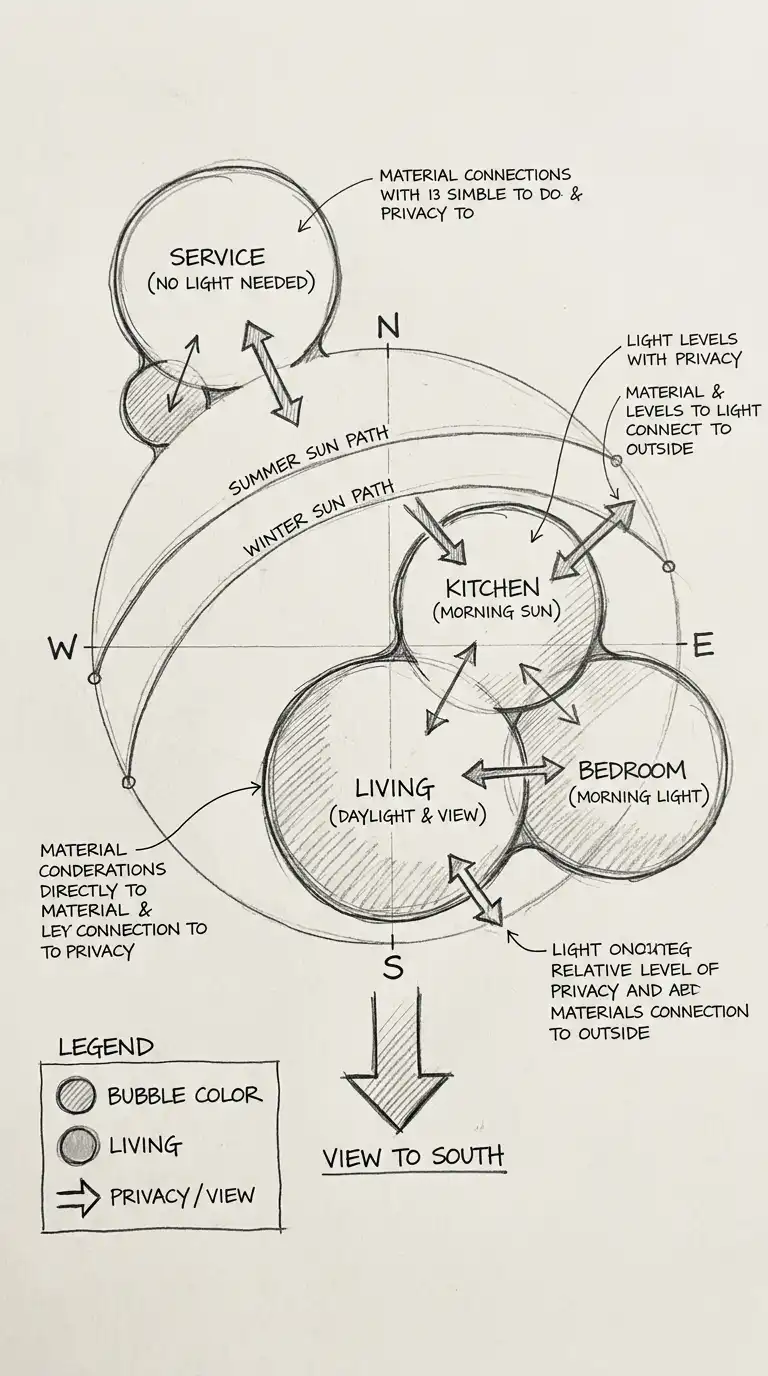
9. The Light and View Bubble Diagram
The light and view bubble diagram places bubbles in relation to sun and view. Bubbles that need morning sun are placed on the east side. Bubbles that need afternoon light are placed on the west side. Bubbles with important views face the view.
This diagram answers: which spaces need light? Which spaces need views? The emotional effect is environmental, site-responsive, and climatically intelligent.
Quick Tips
- Draw the sun path and view direction on the diagram.
- Label each bubble with its light and view requirements.
- Use arrows to show desired orientation.
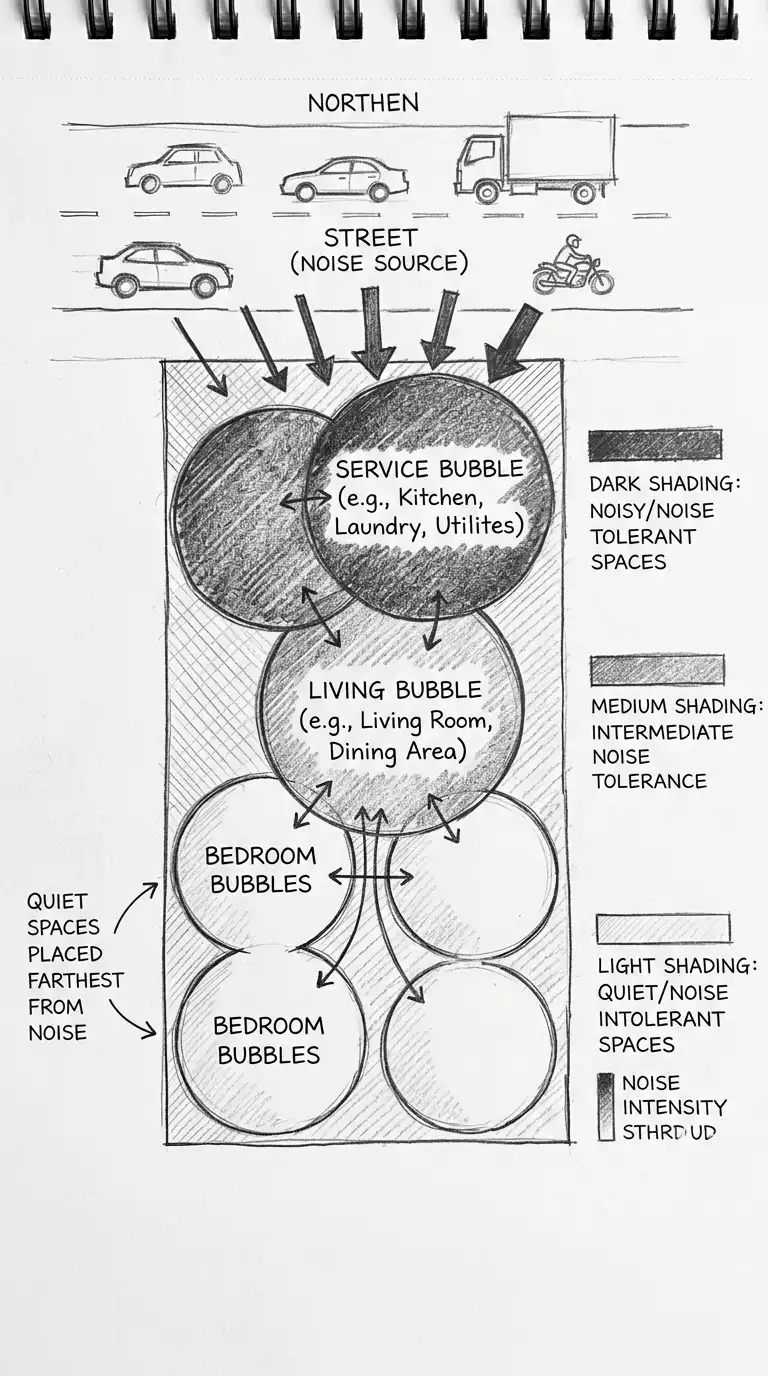
10. The Noise and Privacy Bubble Diagram
The noise and privacy bubble diagram places bubbles in relation to noise sources. Bubbles that need quiet are placed away from noise. Bubbles that can tolerate noise are placed near noise sources.
This diagram answers: which spaces need protection from noise? The emotional effect is acoustic, privacy-oriented, and contextually responsive.
Quick Tips
- Draw noise sources (street, mechanical, neighbours) on the diagram.
- Quiet bubbles should be farthest from noise sources.
- Use different shading: dark shading for noisy spaces, light shading for quiet spaces.
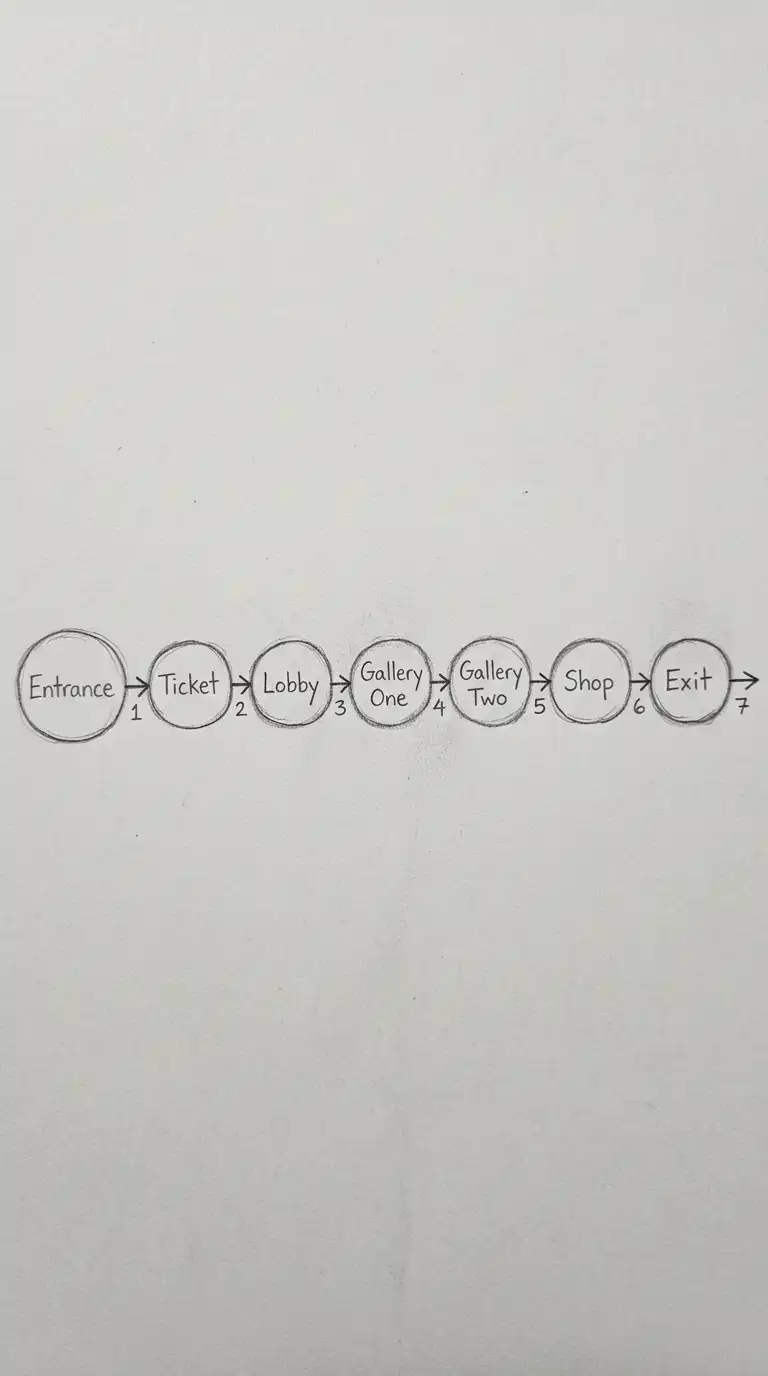
11. The Sequence Bubble Diagram
The sequence bubble diagram shows the order of spaces over time. A museum sequence: entrance, ticket, lobby, gallery one, gallery two, shop, exit. The bubbles are arranged in the order a visitor will experience them.
This diagram answers: in what order will spaces be experienced? The emotional effect is narrative, sequential, and experiential.
Quick Tips
- Arrange bubbles in a line or curve from first to last.
- Use numbered arrows to show sequence.
- Loops and branches are possible — show choices with branching arrows.
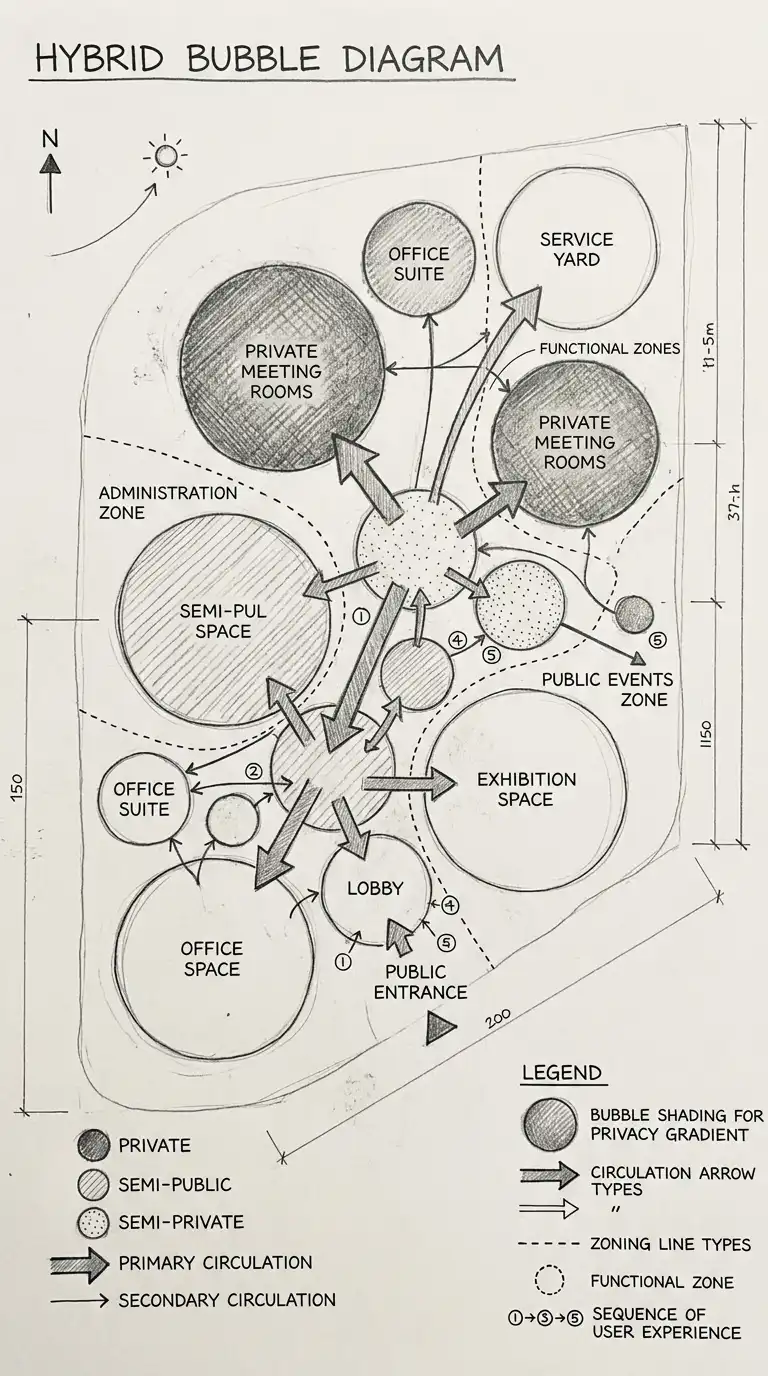
12. The Hybrid Bubble Diagram
The hybrid bubble diagram combines multiple diagram types on one sheet. Adjacency, circulation, privacy, zoning, and site information are all shown in a single, dense diagram. Different shading, line types, and annotations distinguish the different types of information.
This diagram answers: how do all these factors interact? The emotional effect is dense, complex, and synthesised.
Quick Tips
- Use a consistent shading code for different information types.
- Include a legend explaining every shade, line type, and symbol.
- Keep the diagram readable — do not overload it.
Final Thoughts
The bubble diagram is the most underrated tool in architecture. It is not a drawing. It is not a plan. It is a way of thinking. A bubble diagram forces you to ask: what spaces need to be near each other? What spaces need to be separate? How do people move? Where does the sun come from? Where is the noise?
These 12 bubble diagram types are not mutually exclusive. A hybrid diagram can combine adjacency, circulation, privacy, and zoning. A sequence diagram can include light and view requirements. The best bubble diagrams are not the most beautiful — they are the most informative. They answer the questions that matter before a single wall is drawn.